Wyckoff Method Guide – Part 1
Market Meditations | June 9, 2021

? What the Wyckoff?
?♂️ The Composite Man: Recognise Him
“…All the fluctuations in the market and in all the various stocks should be studied as if they were the result of one man’s operations. Let us call him the Composite Man, who, in theory, sits behind the scenes and manipulates the stocks to your disadvantage if you do not understand the game as he plays it; and to your great profit if you do understand it.” (The Richard D. Wyckoff Course in Stock Market Science and Technique, section 9, p. 1-2)
When you sit at your laptop, planning and preparing a trade, your thoughts and preconceptions regarding what the market is are of paramount importance. Similar to all things of paramount importance, they are oftentimes neglected. On his noble quest to help retail investors understand what the market is, Wyckoff created the idea of the Composite Man (of Composite Operator):
- The Composite Man is an imaginary identity of the market.
- He is a single entity controlling the market. He carefully plans, executes and concludes his campaigns.
- In essence, the Composite Man represents the biggest players (market makers), such as wealthy individuals and institutional investors. He always acts in his own best interest to ensure he can buy low and sell high.
The Composite Man’s behaviour is the opposite of the majority of retail investors. However, he uses a somewhat predictable strategy, which we can learn from. In fact, if we are to succeed, we must study charts with the purpose of judging the behavior and motives of those large operators who dominate it.
⚖️ The Three Laws of Wyckoff
Wyckoff is most famous for charts to help understand the behaviour of the Composite Man. These charts are underpinned by three laws:
- The Law of Supply and Demand. One of the most basic principles of economics which is not exclusive to Wyckoff’s work. An excess of demand over supply causes prices to go up because more people are buying than selling.
- The Law of Cause and Effect. Differences between supply and demand are not random; they come after periods of preparation, as a result of specific events. A period of accumulation (or cause) eventually leads to an uptrend (or effect). On the other hand, a period of distribution (cause) eventually results in a downtrend (effect). In the next section, we will explore his methods of defining trading targets based on periods of accumulation and distribution.
- The Law of Effort Vs. Result. Changes in an asset’s price are a result of an effort, which is represented by the trading volume. If the price action is in harmony with the volume, there is a good chance the trend will continue.
? Wyckoff Schematics
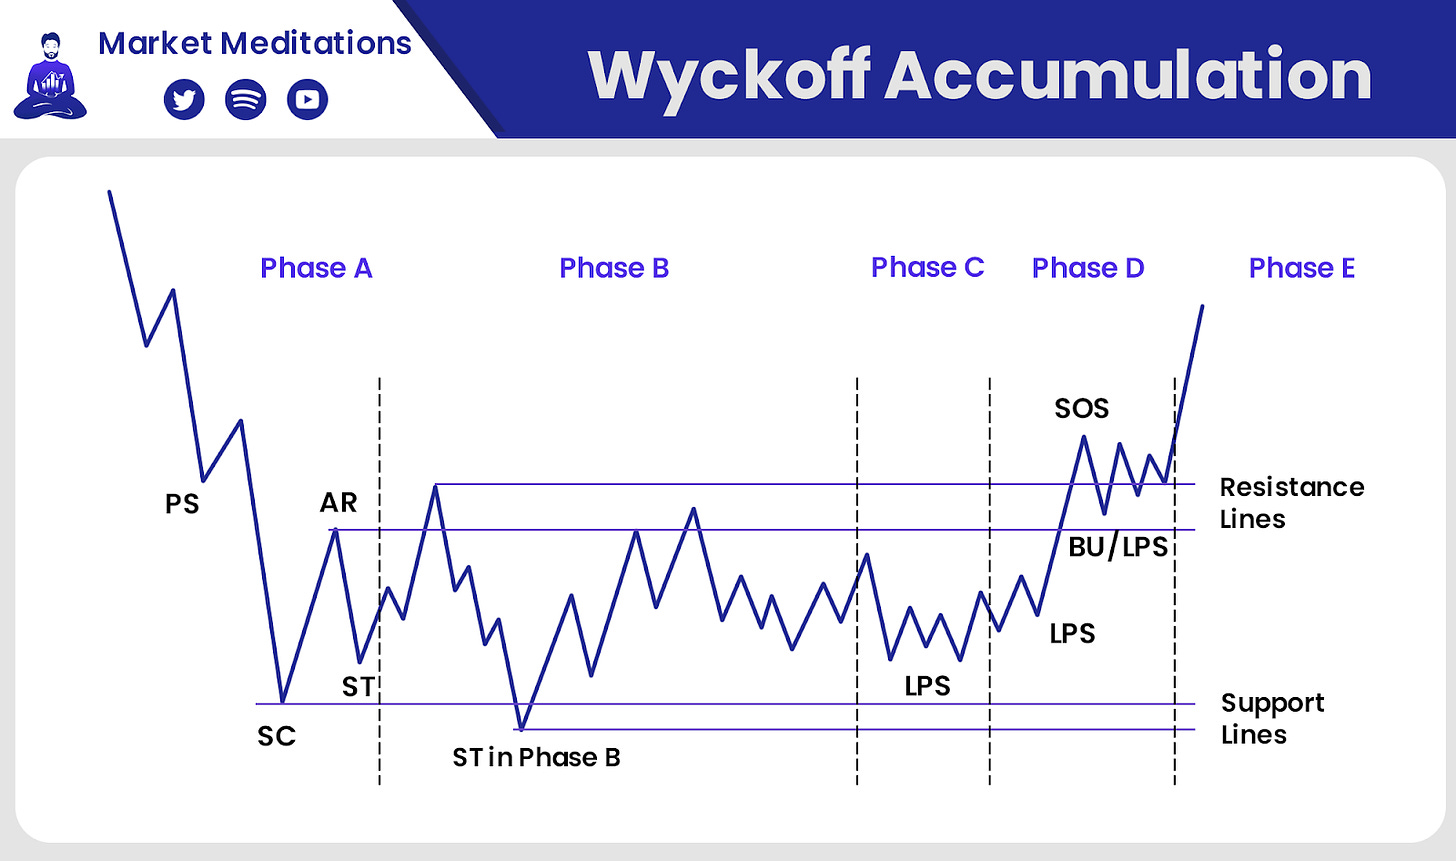
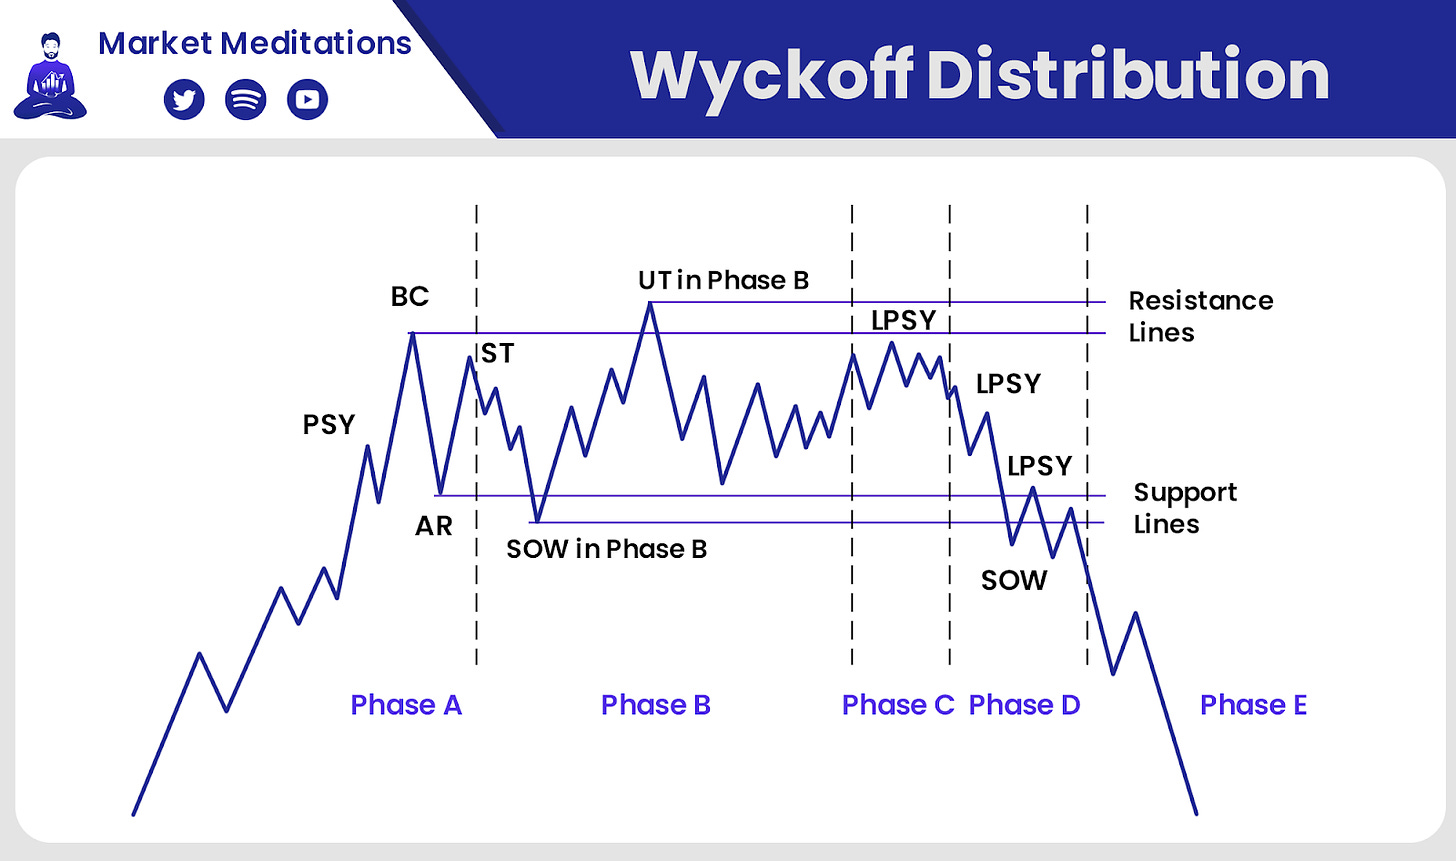
The accumulation and distribution schematics are likely Wyckoff’s most renowned works. Particularly within the cryptocurrency community. His models break it down into five phases (A to E), with so-called ‘Wyckoff Events’ all of which is described below.
- Phase A. Selling force decreases (and downtrend with it). Preliminary support (PS) indicates that buyers are showing up (but it’s not enough to stop the downtrend. Selling Climax (SC) conveys high volatility and panic selling. This quickly reverts into a bounce of Automatic Rally (AR). The Secondary Test (ST) happens when the market drops close to the SC region (testing whether the downtrend is really over or not).
- Phase B. Consider this the Cause that leads to an Effect (if you’re confused, reread the three laws section). This is the consolidation stage, where the Composite Man accumulates the highest number of assets. At this stage, the market tends to test both resistance and support levels of the trading range. For instance, we may see more Secondary Tests (ST) during Phase B. A series of higher highs (bull traps) and lower lows (bear traps).
- Phase C. Referred to as the Spring, it is the final bear trap before the market starts making higher lows. The Composite Man takes the opportunity to ensure that there is little supply left in the market. It serves to stop out traders and mislead investors; his final attempt to buy shares at a lower price before the uptrend starts. At this point, most retail investors have sold their holdings.
- Phase D. Transition between Cause and Effect. Stands between Accumulation zone (Phase C) and breakout of the trading range (Phase E). Phase D shows a significant increase in trading volume and volatility. It usually has a Last Point Support (LPS) making a higher low before the market moves higher. This often precedes a breakout of the resistance levels. We achieve Signs of Strength (SOS) as previous resistances become brand new supports.
- Phase E. The last stage of an Accumulation Schematic. Evidenced by the breakout of the trading range (caused by increased market demand). This is when the trading range is broken and an uptrend starts.
- Phase A. The Distribution Schematic works in the opposite way of the Accumulation. We begin with an uptrend slowing down (due to decreasing demand). The Preliminary Supply (PSY) shows that selling force is present, albeit not yet strong enough to stop the upward movement. The Buying Climax (BC) is then formed by an intense buying activity. Sadly, usually inexperienced traders that buy emotionally. Next we have an Automatic Reaction (AR) as excessive demand is absorbed by the market makers. Remember the Composite Man was accumulating before? Now he starts to distribute to the late buyers. The Secondary Test (ST) occurs when the market revisits the BC region, often creating a lower high.
- Phase B. Consolidation zone. Composite Man gradually sells his assets. Upper and lower bans tested multiple times. Once again, with short term bear and bull traps. The market may even move above the resistance level created by the BC, leading to a ST that can also be called an Upthrust (UT).
- Phase C. Opposite of an Accumulation String. One last bull trap after consolidation. Called the UTAD or Upthrust After Distribution.
- Phase D. Again, similar to Accumulation Schematic. Last Point of Supply (LPSY) in the middle of range. Evident Sign of Weakness (SOW) when the market breaks below the support lines.
- Phase E. Beginning of downtrend, evident break below the trading range. Looping back to the first law: strong dominance of supply over demand.
? Putting It Altogether
Regular readers will probably know our stance on the Wyckoff Method. It is but one in a world of technical indicators and should not be used in isolation to make trading decisions. Rather, we’d suggest these be your key takeaways:
- Observe how the Wyckoff Method allows investors to make more logical decisions rather than acting out of emotion.
- Appreciate the role of the Composite Man. When you are trading, you are competing against hundreds of thousands of people. All trying to accumulate fear and sell greed. Don’t allow yourself to become a puppet in their game. Try to think of the bigger picture, and not only what you think of the market but also what market participants may be trying to make you think. Especially big money, who have the resources to move the market.
- Be aware that these types of methods might be self fulfilling. With enough people watching and believing in them, they will likely trade according to them.


