Continuation Patterns
Market Meditations | May 20, 2021

Let’s recall our battle analogy from Part 1:
- Candlestick charts show two armies warging war.
- The bodies of the white candles represent the bull army and the bodies of the purple candles represent the bear army.
- The chart represents the battlefield.
- Both armies are trying to get into each other’s territory.
- Wicks show failed attempts to get into army territory.
- Remember, if you’d like to Koroush guide you through this analogy on video, click this link.
Today, we are going to look at examples of Continuation Patterns. Or, in other words, situations where the current trend is likely to continue after a brief period of consolidation. This is in contrast to reversal patterns wherein the current trend is likely to reverse after consolidation.
♦️ 2 Continuation Patterns
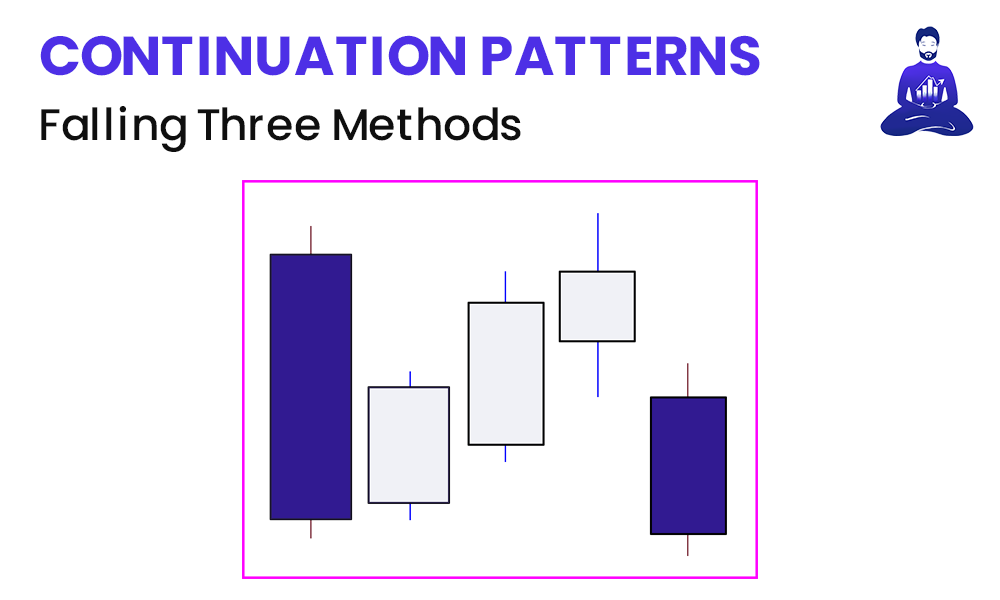
? HOW TO IDENTIFY A FALLING THREE METHODS: This is a bearish continuation pattern in which price action is in a downtrend, consolidates briefly, and then continues a downtrend. More specifically, the pattern consists of a bearish candle, followed by three consecutive bullish small-body candles during a period of consolidation, followed by a strong bearish candle before continuing the downtrend.
⚔️ WHAT IT MEANS IN BATTLE: Given this pattern begins during a downtrend, it signifies that the bear army is in full control of the battlefield. Bears began advancing aggressively into bull territory during the first candle. The bull army tries to fight back, however because the bodies of each of the three consecutive candles are small, it symbolises that the bull army was unable to push into bear territory in any meaningful way. On the subsequent candle, the bear army comes out strong and pushes back far into bull territory, therefore resuming the downtrend.
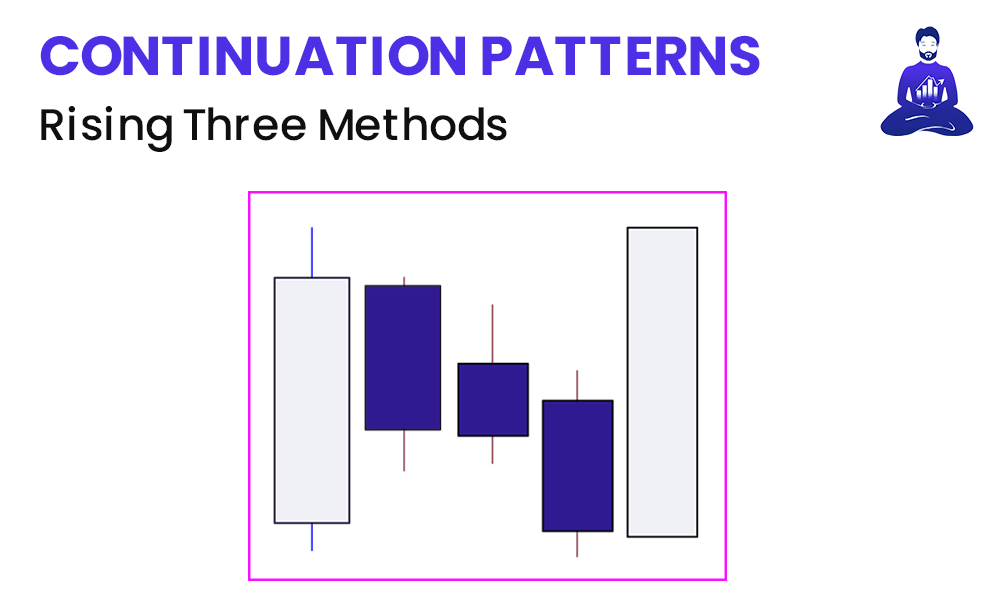
? HOW TO IDENTIFY A RISING THREE METHODS: This is a bullish continuation pattern in which price action is in a uptrend, consolidates briefly, and then continues a uptrend. More specifically, the pattern consists of a bullish candle, followed by three consecutive bearish small-body candles during a period of consolidation, followed by a strong bullish candle before continuing the uptrend.
⚔️ WHAT IT MEANS IN BATTLE: Given this pattern begins during an uptrend, it signifies that the bull army is in full control of the battlefield. Bulls began advancing aggressively into bear territory during the first candle. The bear army tries to fight back, however because the bodies of each of the three consecutive candles are small, it symbolises that the bear army was unable to push into bull territory in any meaningful way. On the subsequent candle, the bull army comes out strong and pushes back far into bear territory, therefore resuming the uptrend.
♦️ Introducing Dojis
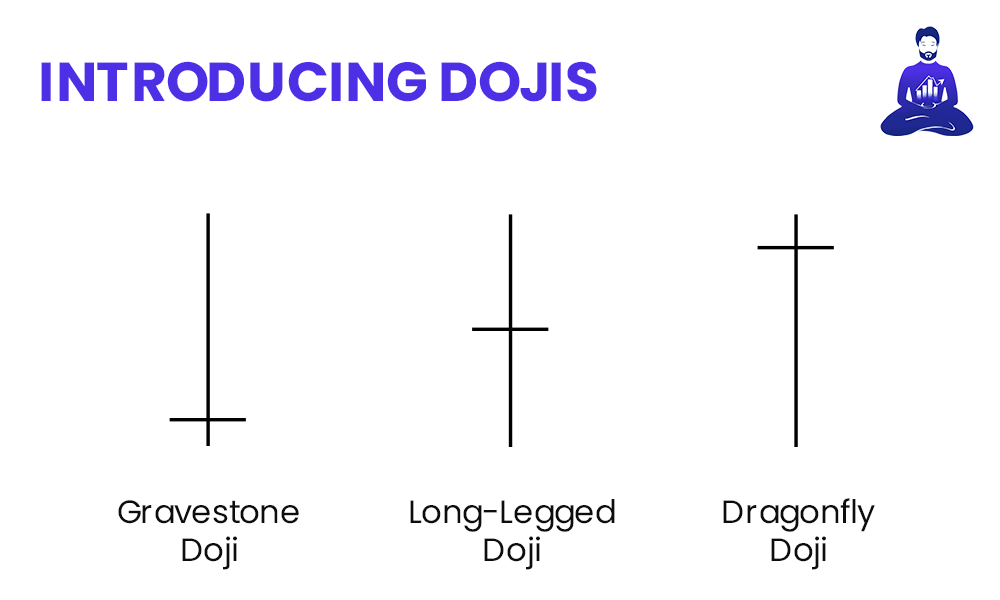
? HOW TO IDENTIFY A DOJI: A Doji forms when the open and close are the same (or very close to each other). The price can move above and below the open but eventually closes at or near the open. Technically speaking, a Doji occurs when the open and close are the exact same. As such, an exact Doji is rare. If the open and close aren’t the same but instead very close to each other, this is described as a spinning top. A spinning top is often used interchangeably with the Doji.
⚔️ WHAT IT MEANS IN BATTLE: A Doji indicates heightened tension between the bull and bear army. An indecision point between buying and selling forces. Depending on where the line of the open/close falls, a Doji can convey different messages in battle.
Gravestone Doji ➡️ bearish reversal candle with a long upper wick and the open/close near the low.
Long-legged Doji ➡️ indecisive candle with both a lower and upper wick, and the open/close near the midpoint.
Dragonfly Doji ➡️ either bullish or bearish candle (depending on context) with a long lower wick and the open/close near the high.


