Stock to Flow
Market Meditations | May 26, 2021

Although newcomers to the space have been shocked by the turn of events over the past week, even the most seasoned of crypto veterans have gone on record saying the volatility has been some of the highest they’ve ever seen.
We’ve said time and time again that during periods of heightened volatility, it’s helpful to zoom out on the fundamentals and technicals of the space.
? The Stock to Flow model (S2F) is one tool in our toolbox to do just this. In this article, we’ll explain what S2F is, how to use it, and where to access it. Before we begin, however, we’d like to remind you that you should never use one model or indicator in isolation.
Often, models including but not limited to S2F rely on previous data to help us gain insight into the future. History, however, does not have to repeat itself and this is especially true for markets.
⚠️ Make sure that, when reading this article, you use it as confluence with your fundamental and technical analysis, risk management, and financial goals to create a trading and investment strategy that works for you. Check out our video about creating your profitable trading strategy to learn more.
❓What Is It
Put simply, S2F is a way to quantify scarcity. It uses data to answer the question:
“How abundant is this asset or commodity?”
Whilst many investors here might know of S2F with respect to crypto, in actuality the model was originally applied to natural resources like gold, silver, oil, etc.
1️⃣ EXAMPLE. Using the example of gold, the World Gold Council has estimated that the total amount of gold ever mined is approximately 200,000 tons.
2️⃣ STOCK. This is where the “stock” facet of the “stock to flow” phrase comes from.
3️⃣ FLOW. Similarly, the WGC estimated that 3,000 tons of gold are actively mined each year. This is where the “flow” facet of the phrase comes from.
In other words, to measure the scarcity of an asset, the model looks at the total current supply and added supply of any resource or commodity.
4️⃣ RATIO. To calculate the S2F ratio, take the total current supply (or stock) and divide it by the added supply (or flow) of any asset.
? How To Use It
How can we use S2F to our advantage as traders and investors?
- A higher stock to flow ratio indicatesthat less supply is entering the market relative to total supply.
- A lower stock to flow ratio indicates the opposite, namely that more supply is entering the market relative to total supply.
Although we have been conditioned to believe that a lower supply is superior, it’s important to note that the concept of what is superior depends entirely on what the commodity or resource’s use case is.
? INDUSTRIAL COMMODITIES. Industrial commodities, for example, are valuable because they are consumed and are not meant to be a store of value. One example of this is textiles, which derive their value from being a raw material used in creating furnishings, carpetings, towels, coverings for tables, beds, and other flat surfaces.
? It follows that the lower the S2F ratio is for textiles, the better.
Commodities with lower S2F ratios, however, typically make for poor investment assets over the long run due to this increasing supply. Assets with a S2F that trends higher typically make for higher probability investments, especially as demand for the asset grows at the same time the supply decreases. If supply decreases at a shockingly fast pace, as can be argued is the case for Bitcoin, the asset may perform exceptionally well. Check out our podcast episode where we discuss trading crypto and commodities.
? BITCOIN. Applying S2F to Bitcoin equates the crypto asset to other precious metals like gold and silver. The reason for this is that both Bitcoin and precious metals like gold and silver share the property of relative scarcity and low flow (i.e. a high S2F).
? The conclusion one could draw strictly using S2F, then, is that Bitcoin and precious metals make for a good investment due to the decreasing supply. Let’s discuss this a bit more.
- One reason proponents of S2F argue that Bitcoin is a generational investment is due to the mechanism known as the Bitcoin halving, which drastically reduces supply every four years more than any other asset of which we are aware.
- We know that Bitcoin’s maximum supply is 21 million and the current circulating supply is nearing 19 million, but the real fuel to the fire is the fact that the “flow” of Bitcoin is halved approximately every four years with the Bitcoin Halving.
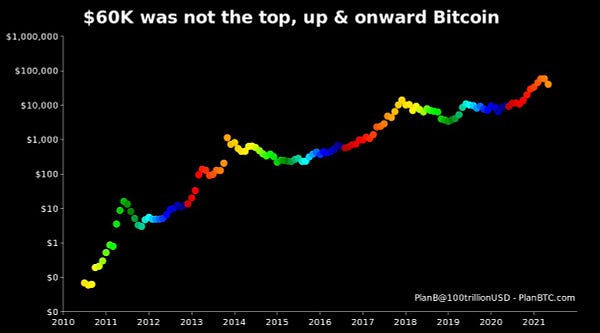
This phase sharply increases the S2F ratio, and according to proponents of the model has direct correlation with price appreciation. In fact, according to this tweet inspired by S2F, the Bitcoin bull market is not over and “60k was not the top.”
? Where To Access
If you would like to track the S2F live, you can do so here.
The page is inspired by the article Modeling Bitcoin’s Value with Scarcity written by PlanB (@100trillionUSD) and the data and charts are updated every five minutes.
It’s important to remember that the S2F only accounts for supply, which is only one factor in whether an investment has a high probability of increasing in price. It’s worth having an understanding of catalysts, demand for an asset, narratives, and other things that impact the price of an asset short and long term.


