🧘♂️Top 3 DeFi Indicators
Market Meditations | May 3, 2021

Dear Meditators
Welcome to our first newsletter of the week. And what a start to the week it has been, with Ethereum and Bitcoin in the green. Today’s focus will be on our Top 3 Tools for valuing DeFi projects. Read, enjoy and share with your network. Let’s all build wealth together.


Crypto. Bitcoin holds support and faces resistance at $60k whilst Ether is on a winning streak, surging to record over $3.2k (more on this later).
Legacy. Stocks came off session highs as giants Tesla Inc. and Amazon.com Inc. weighed on the Nasdaq 100. Traders also assess economic data, with inflation remaining at the forefront of the investment debate.
Right now we’re earning up to 30%/year lending on FTX… One of our favourite ways to make money in this market, make sure to use our link to get a discount. Based in the U.S? Here’s a discount link for you: FTX.US.


With the volume of new DeFi projects in the space, it can be difficult to ascertain the “intrinsic” value of DeFi assets. We’ve turned our attention to how our readership can best determine whether a protocol is overvalued or undervalued. Free resources we have created on this topic so far: On Chain Analytics Guide and Project and Financial Metrics Guide. Today, we look at more commonly used indicators to value DeFi projects. None of these indicators in isolation are definitive ways to calculate valuation. Use them in combination with other indicators, however, and you might just build an edge in the market.
1️⃣ Total Value Locked / Fully-Diluted Market Cap
Total Value Locked (TVL) represents the amount of assets that are currently being staked in a specific protocol. With the argument going that the higher the value locked up in a DeFi DApp (decentralized application), the better.
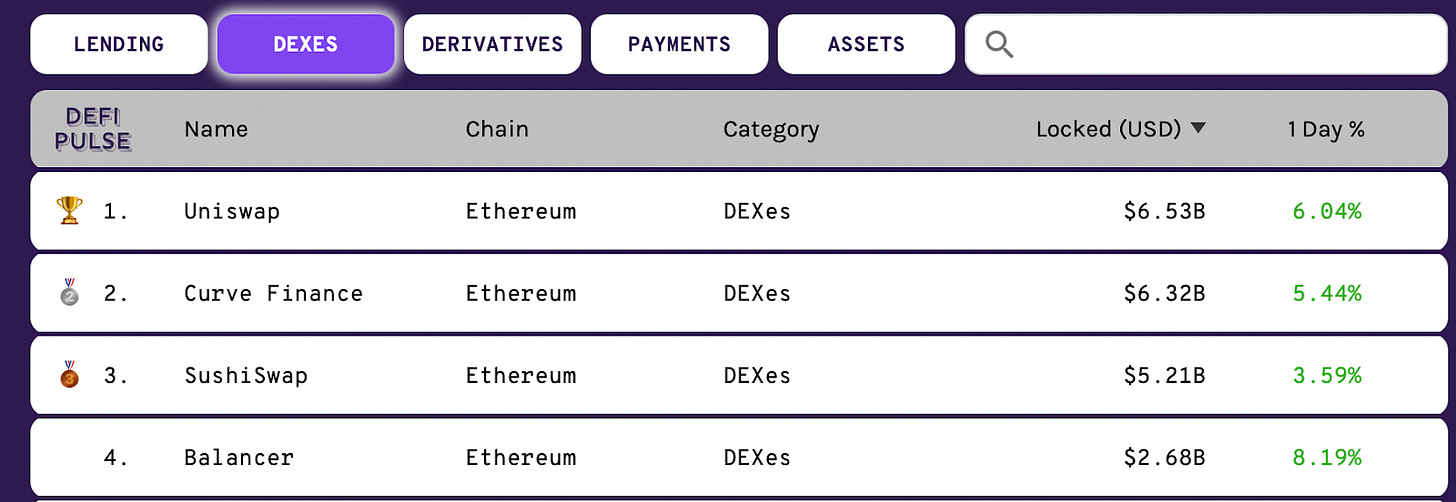
GETTING STARTED. To find data on TVL, DeFi Pulse (defipulse.com) is a great resource and starting point.

The ‘locked’ data point displays the total number of BTC, ETH or DAI being used in the DeFi ecosystem and the homepage lists all of the protocols and their ranking by TVL. For each protocol, by clicking on the relevant name, you can find key growth stats, charts, a summary of the application and relevant links (including audits).
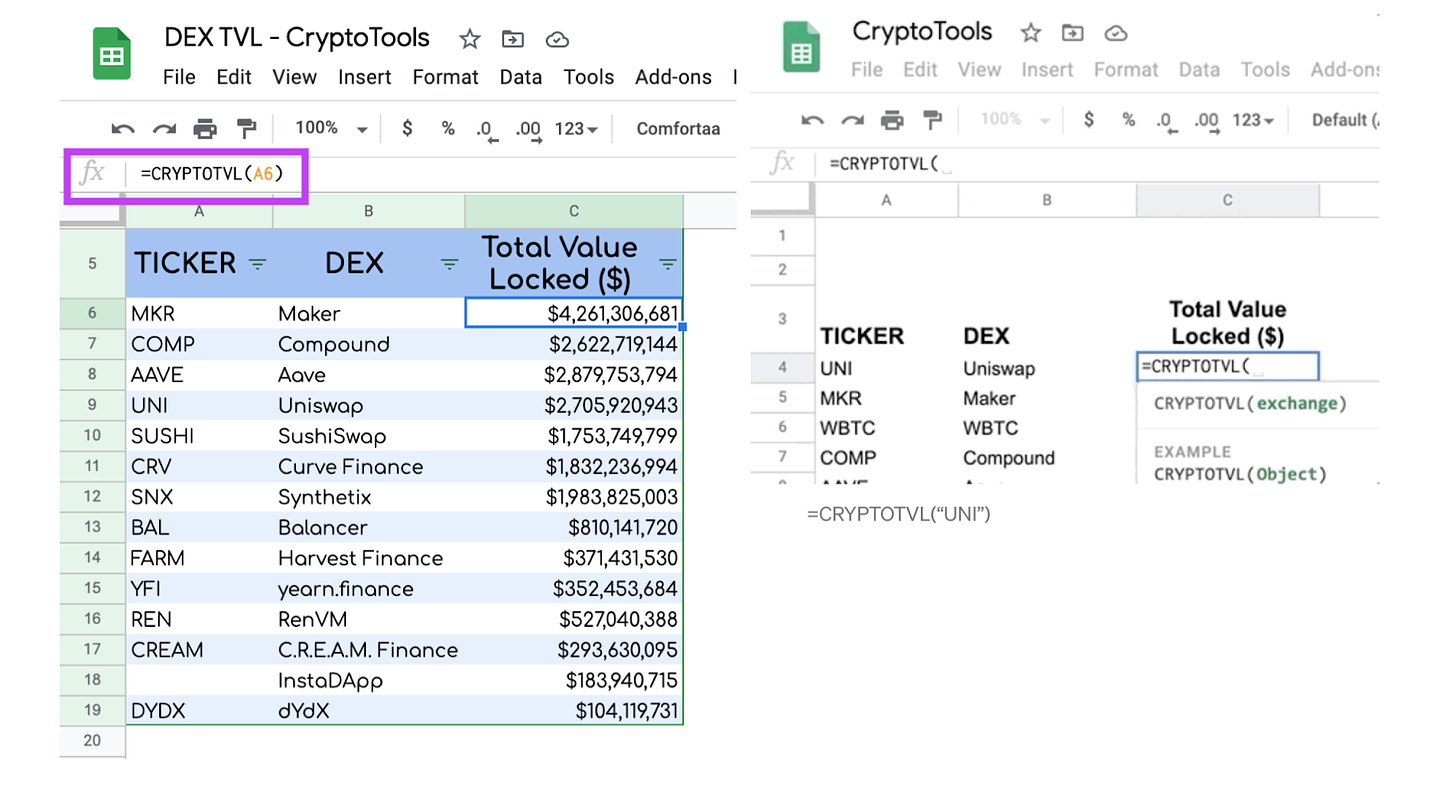
FURTHER RESOURCES. CoinGecko (https://www.coingecko.com/en/defi) also provides TVL data and for those who are in the business of using excel or google sheets to track their investments, here is a resource that provides TVL in Google Sheets for data analytics purposes, allowing you to create your own live TVL tracker.

Source:https://medium.com/coinmonks/google-sheets-analytics-total-value-locked-in-defi-33b926c18a9f
We mentioned that TVL represents the amount of assets that are currently being staked in a specific protocol. On Wednesday, we’ll be releasing a full guide on what staking is and a step by step of how you can start earning yields through staking. To make sure you receive this guide, join our free Market Meditations community:
2️⃣ Price-to-sales ratio (P/S ratio)
In legacy markets, the price-to-sales (P/S) ratio is a valuation ratio that compares a company’s stock price to its revenues. It is an indicator of the value that financial markets have placed on each dollar of a company’s sales or revenues.
DeFi protocols also generate revenue. If you are curious about the revenue generated by different networks and protocols, you can find this information here, organised by the 1 Day and 7 Day averages. Since many DeFi protocols already generate revenue, a similar metric to the P/S ratio can be used for them as well:
Crypto P/S ratio = (Market Capitalisation of the Protocol ÷ Revenue)
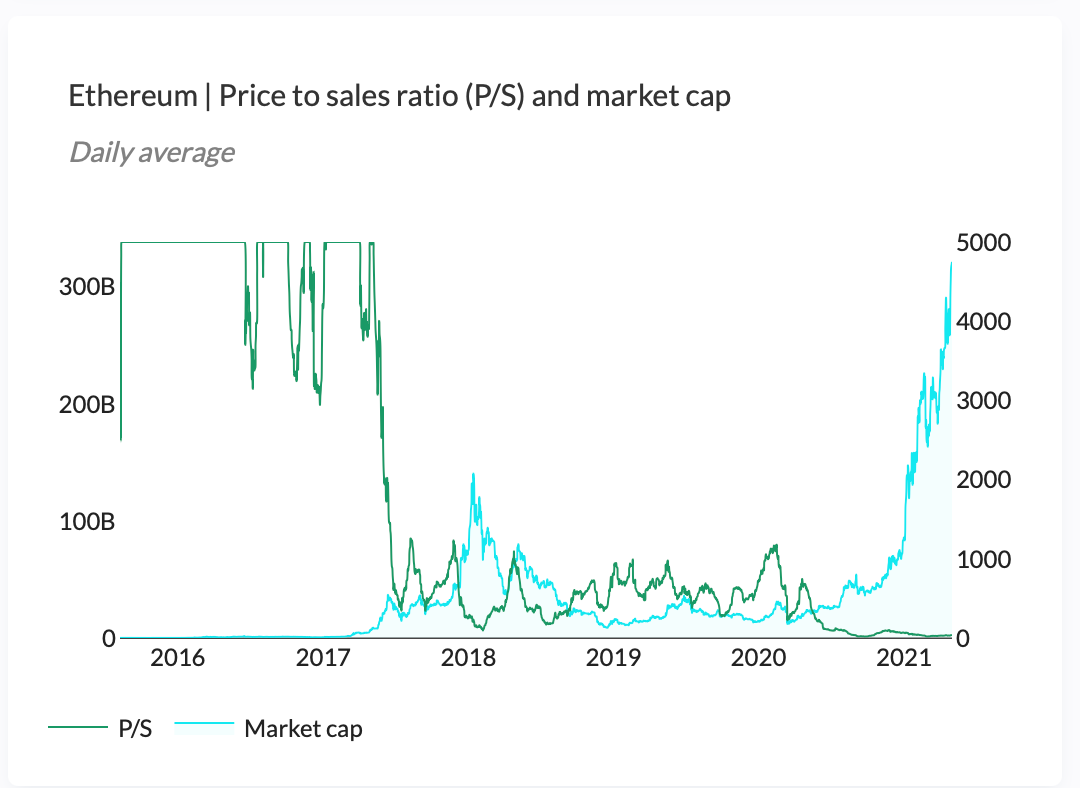
The basic idea is that the lower the ratio is, the more undervalued the protocol may be. In the case of Ethereum, Grayscale reported back in February 2021 that Ethereum was undervalued from a P/S ratio perspective. Ethereum’s P/S ratio at the start of 2021 was the lowest it has been for over 3 years at around 0.02.
“A lower ratio indicates that the network is generating high revenue relative to Ether’s historical market capitalization, and thus may be undervalued”.
GETTING STARTED. TokenTerminal (https://terminal.tokenterminal.com) provides data on Price-to-Sales ratios. Below is a screenshot that demonstrates Grayscale’s point on Ethereum’s low P/S ratio relative to its market capitalization.

Source: https://terminal.tokenterminal.com/dashboard/Price-to-sales
3️⃣ Token Supply and Balance Change on Exchanges
We were fortunate enough to get Ki Young Ju, founder of CryptoQuant onto the Market Meditations podcast. Full episode here. He explained how we can read token supply and balance change on exchanges to understand market dynamics. It all comes down to supply and demand:
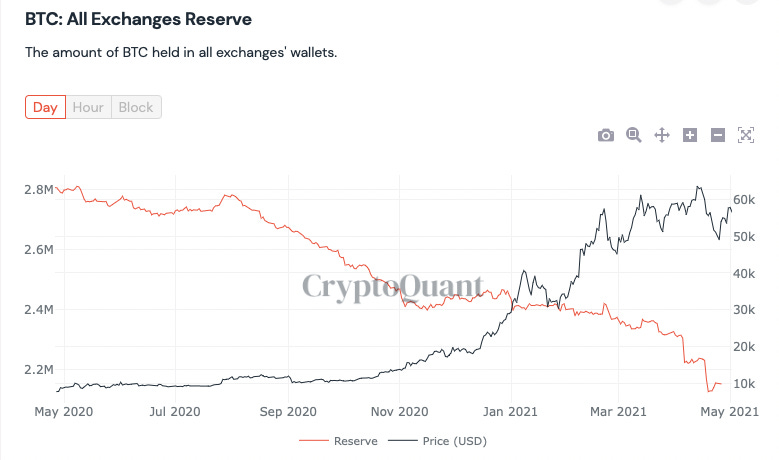
BTC reserves (supply) on exchanges -> indicates selling pressure -> downward trend. The idea being that since holders and whales aren’t holding their funds in their own wallets, it could be likely that they are looking to sell them.
Stablecoin reserves on exchanges -> indicates demand pressure -> upward pressure.
GETTING STARTED. There are a range of resources available to access this data. Albeit, not all are free. For Bitcoin and Stablecoin flows, you can access some data from CryptoQuant for free.
Free link for BTC Exchange Flows:

Note exchange reserves of BTC are still declining, suggesting demand remains high.
Free link for Stablecoin Exchange Flows.
You can also follow Ki Young Ju and CryptoQuant on twitter for free and regular charts and updates. We previously mentioned Grayscale’s monitoring of Ethereum via the P/S ratio and so too did Ki indicate increased demand for Ethereum last month using exchange outflows:
FURTHER RESOURCES. Other resources are available at nansen.ai and glassnode.
? If you’re serious about crypto trading and investing, consider joining our community and gaining access to the full range of insights and analysis ?

Ethereum Bigger than Bank of America
Recently, the price of Ethereum surged past the psychological level of $3,000 and rocketed towards $3200 with little to no consolidation. This price increase has led Ethereum to overtake the likes of Bank of America and Walt Disney in terms of total market cap, growing over 24% in a single week to $363B+ according to CoinMarketCap.

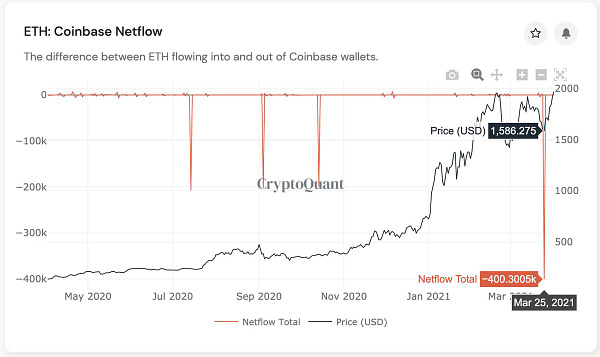
Taking a long time horizon, the future of Ethereum appears bullish. Institutional investors have begun expressing interest in Ethereum, such as the European Investment Bank announcing its intent to issue two year digital bonds with companies like Goldman Sachs. Coinbase specifically saw an outflow of 400K ETH from its exchange and some have speculated that this is a result of institutions building long swing positions. Likewise, the London hardfork, which is responsible for introducing EIP-1559 and the transition from Proof-of-Work to Proof-of-Stake, can reduce selling pressure by 90% due to its fee-burning mechanism and make ETH deflationary. Check out our YouTube video to see exactly how.
In the short term, this chart illustrates that the recent rally has been driven by spot not leverage positions. When rallies are driven by leverage they become more unsustainable as big money “wipes out” overleveraged traders before moving the market higher. In fact, the recent Bitcoin correction was largely due to overleveraged longs leading to the 2nd biggest liquidation event after March 2020. It’s worth nothing, however, that even if the rally is driven by spot rather than leverage, the market can still correct. Make sure to have your risk management and profit taking plan created ahead of time so that you’re not caught off guard.

On Mondays, our ‘Scan The Week’ section is designed to show our community what events and headlines we will be keeping an eye on.
Monday, 3rd May
Mainnet Upgrade
The REN Mainnet will upgrade to v0.4.0 on Monday, May 3, 2021 Through Sunday, May 9, 2021. The v0.4.0 upgrade brings improvements to mainnet and lays the groundwork for control of the RenVM (Virtual machine) to be handed from developers to users.
Tuesday, 4th May
MM Podcast Release #67 Masterclass: Improve Your Trading through Psychology with Koroush AK ?
In this episode, we look at actionable insights from 3 books on trading and investing.
Wednesday, 5th May
Uniswap V3
Mainnet Launch is scheduled for May 5, with a scalable Optimism L2 deployment set to follow soon after. The core feature of v3 is “Concentrated Liquidity” positions which gives each LP full control over what price ranges they wish to provide liquidity to.
Thursday, 6th May
IEEE International Conference on Blockchain and Cryptocurrency
The 3rd IEEE International Conference on Blockchain and Cryptocurrency (ICBC) is a premier international conference dedicated to advances in blockchain, distributed ledgers and cryptocurrency.MM Podcast Release #68 How to Trade Like Alameda with Sam Trabucco ?
Sam Trabucco is a quantitative trader at one of the world’s best crypto trading firms, Alameda Research.
Friday, 7th May
April Jobs Report
The most bullish economists think the US could have added upwards of 1 million new jobs last month.
Some of the links we’ve included are affiliate, they give you rewards and discounts and earn us a commission. Disclaimer: The content in this newsletter is for informational purposes only. Nothing in this email is intended to serve as financial advice. We are not financial advisors. Every investment and trading move involves risk. Do your own research when making a decision.

